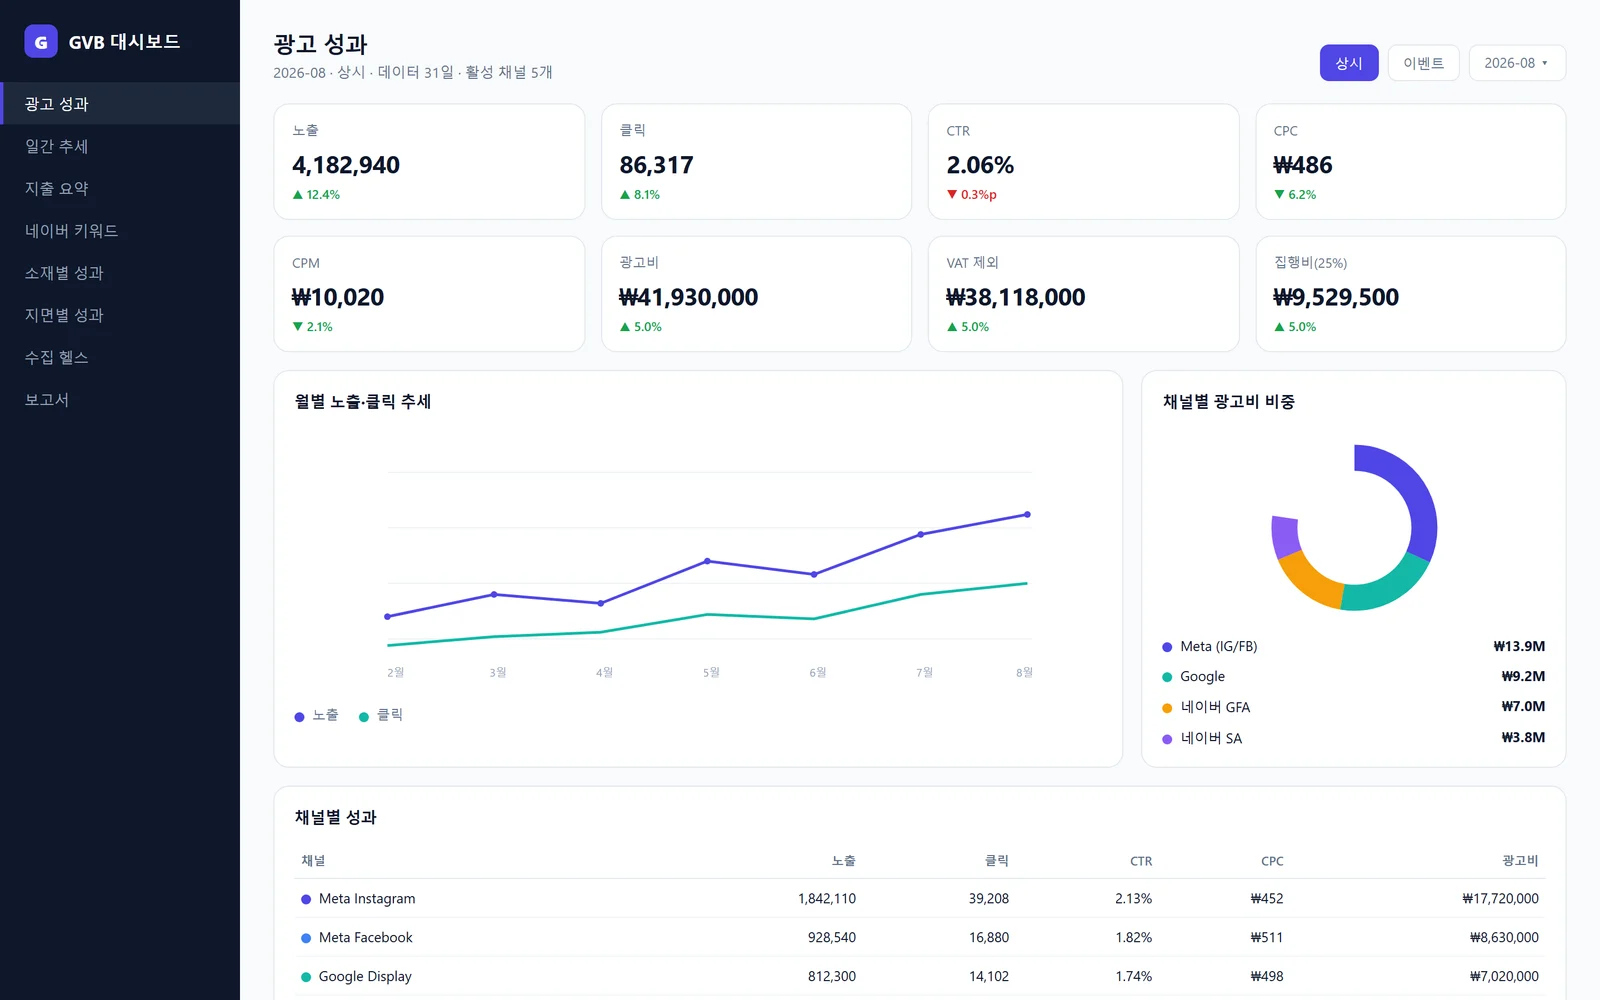
Guam Visitors Bureau — a multi-channel ad performance dashboard
Guam Visitors Bureau · Ad performance once seen only in monthly reports, now a daily dashboard by channel, keyword and creative
Monthly → daily
automated collection
Report cadence
Instant
health page & alerts
Failure detection
Fixed in code
legacy report formulas ported
Metric definitions
Keyword & creative
by channel
Drill-down
Overview
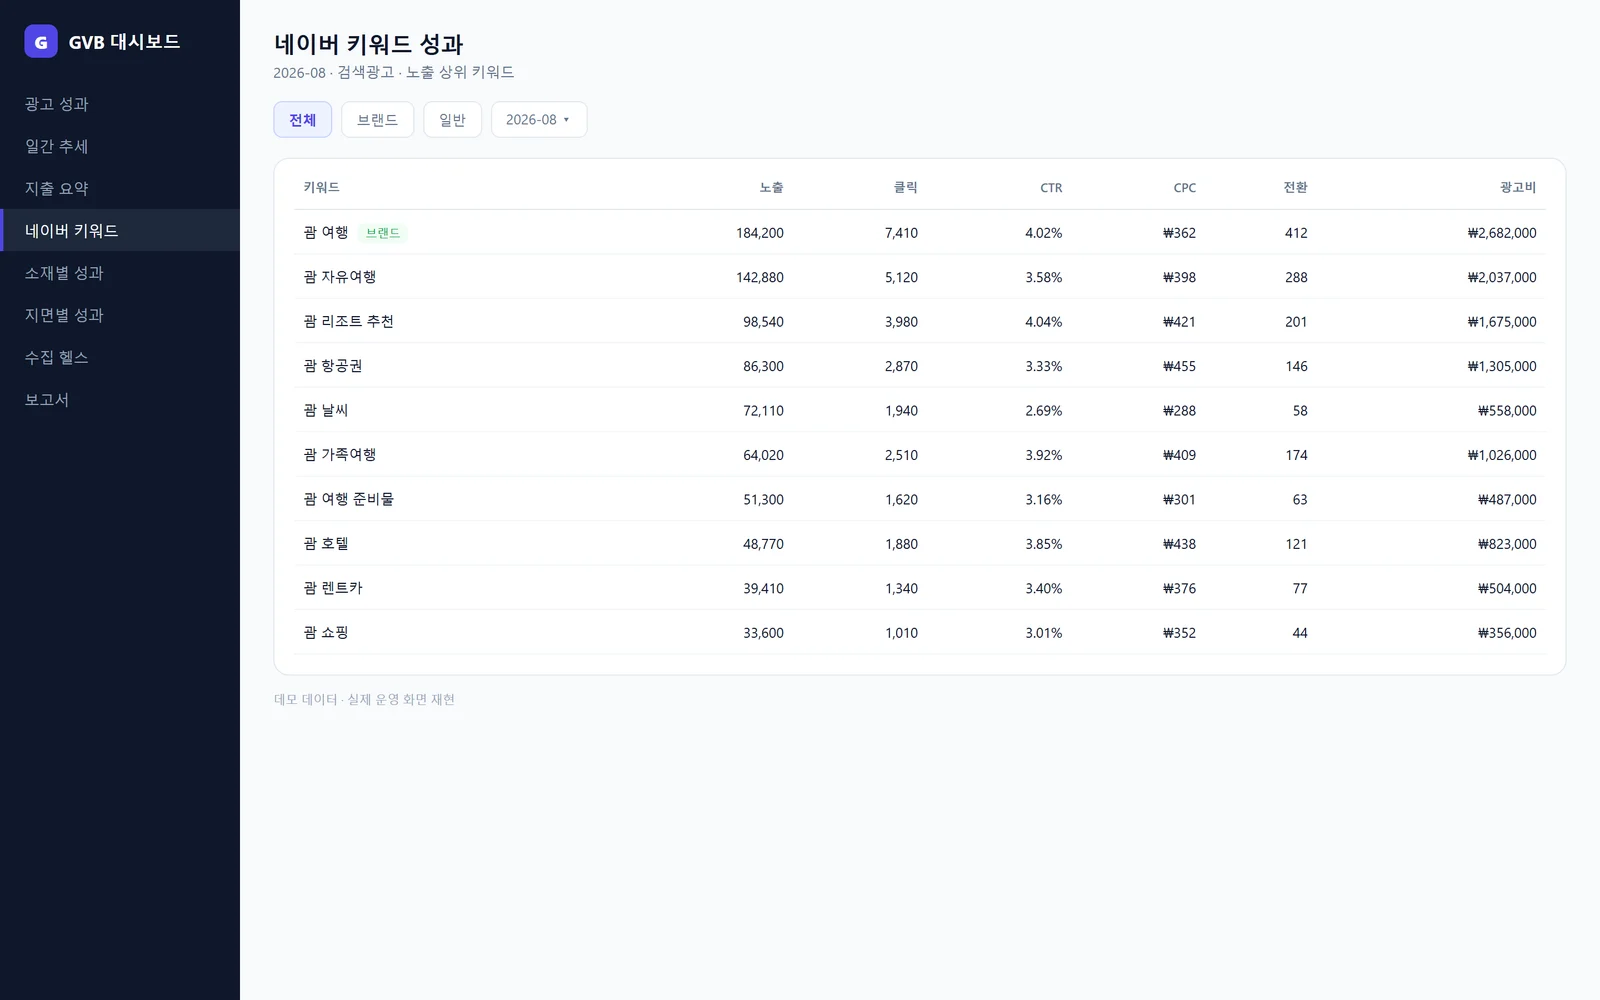
An internal dashboard consolidating the bureau’s Korean-market digital ad performance: spend, impressions and click trends by channel, Naver keyword/creative/placement results and collection-pipeline health behind a password gate, with report files organised by period.
Challenge
Each channel reported in its own format, so merging tables took days at month-end. Failed collections went unnoticed, and metric definitions drifted whenever staff changed.
Solution
Channel data is collected daily into one schema and shown with identical definitions on monthly, channel and daily views. Collection failures surface on a health page and via alerts, and the formulas from the legacy Power Query report were ported so numbers reconcile with past reports.
Strategy
Freeze definitions
Legacy report formulas moved into code so numbers stay the same when people change.
Daily collection
A pipeline loads each channel’s data in one shape every day.
Screen design
Monthly summary → channel → daily → keyword/creative drill-down.
Ops visibility
A health page and alerts make collection failures obvious immediately.
Execution
Want similar results?
Get a free consultation and we'll propose a marketing strategy tailored to your business.
Request a free consultationA strategist replies within 24 hours on business days.
More success stories
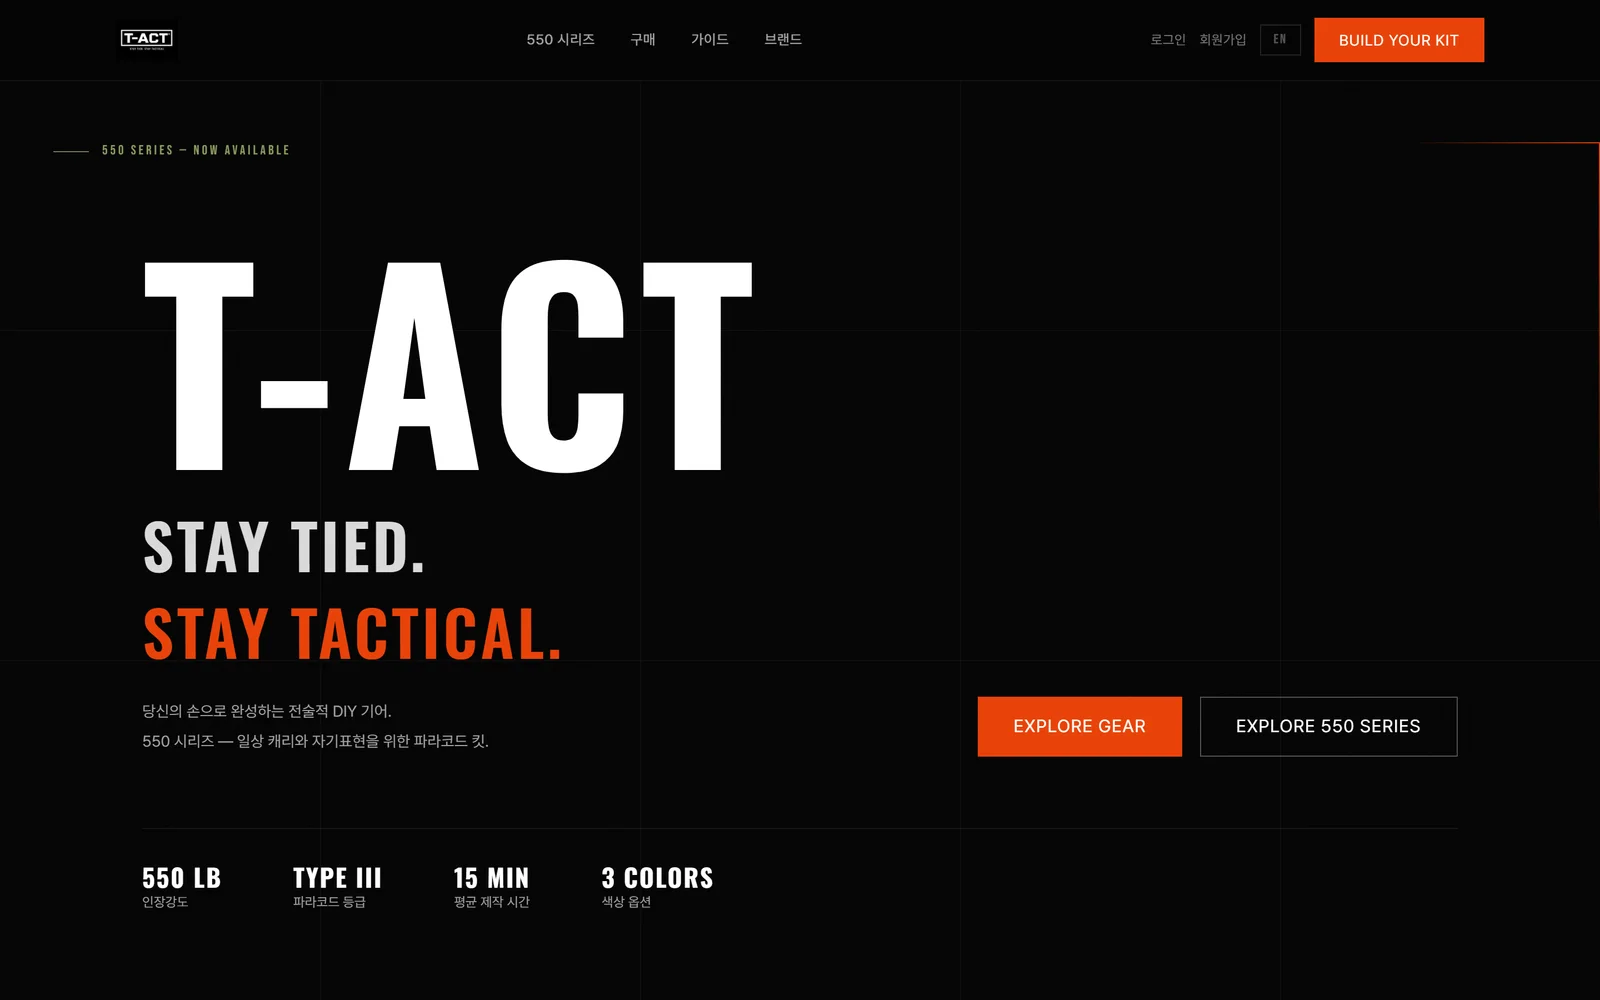
T-ACT — a bilingual storefront for paracord tactical gear
A Korean/English brand store taken from concept to checkout in eight weeks
8 wks
Time to launch
2
Languages

Petletter for Paws — a pet-goods brand store with a 3D customizer
Brand story to name-engraved bowl customization, all in one store
12 wks
Build time
4
Categories
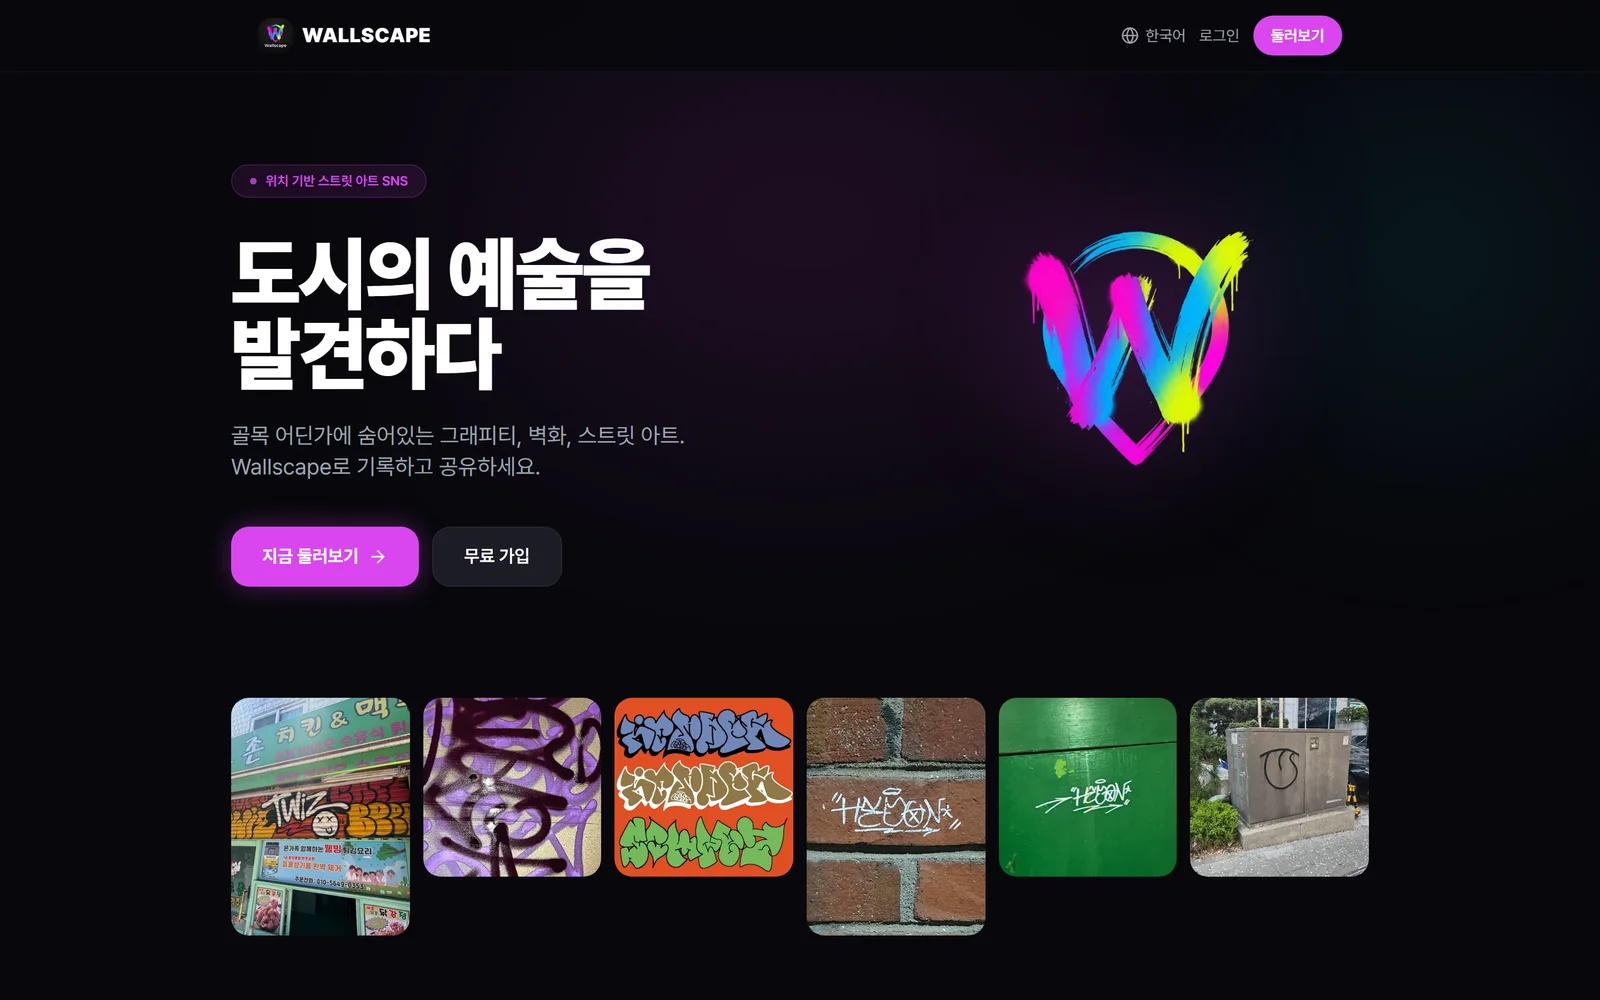
Wallscape — a location-based social network for street art
A map-first archive shipped to web, PWA and Android from one codebase
3
Platforms
2
Languages