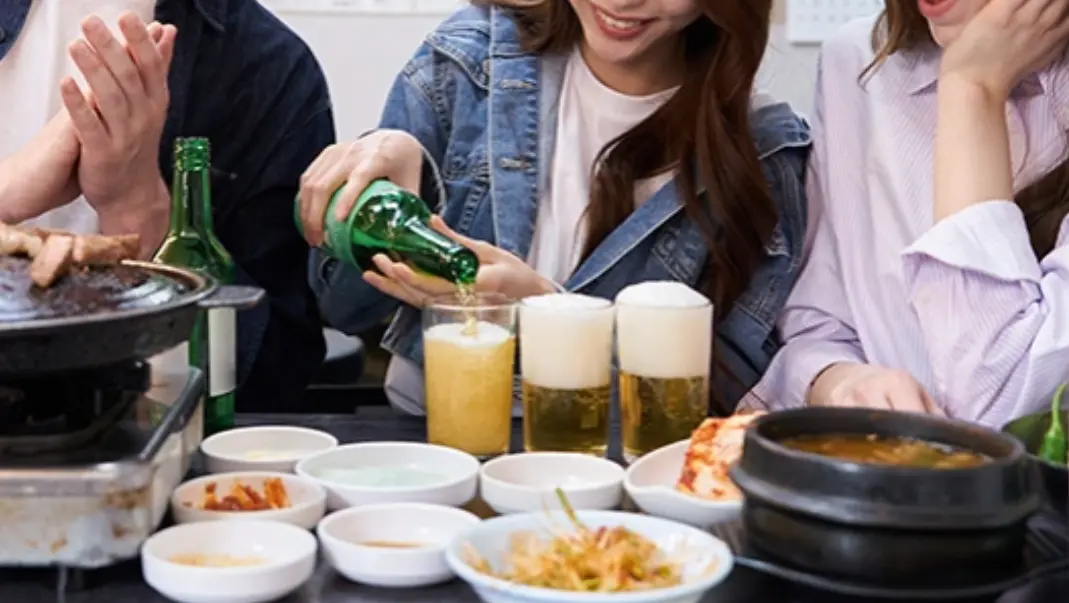
Korea's alcohol shipments fell to 2.987 million kiloliters in 2025, the lowest level since the 1998 financial crisis, according to the National Tax Service. Beer, soju and makgeolli volumes have declined for three to five straight years, and real household spending on alcohol has fallen for ten consecutive quarters since Q4 2023. Yet receipt-level data tells a different story about alcohol consumption trends: once the panel stabilized in November 2025, 45–51% of shoppers bought alcohol at retail at least once a month.
The analysis comes from Team Limited, which weighted 19 months (January 2025–July 2026) of purchase receipts from its receipt app Younggul to correct for user bias.
Why retail buying holds up while shipments fall
Shipment data covers everything, including bars and restaurants. Receipt data captures only what people buy at convenience stores, supermarkets and hypermarkets. A government survey also found average drinking days per month fell to 8.8 in 2025 from 9.0 in 2023. Read together, the picture is a shift in where people drink: fewer company dinners and nights out, steady at-home and solo drinking.
- Monthly purchase penetration rose from 41.17% to a peak of 51.02% in February 2026, then settled at 46–47%.
- Cutting retail budgets because the total market is shrinking may be backwards. If retail is absorbing demand that left on-premise channels, the fight for shelf share gets tougher, not easier.
Each category has its own season
- Beer was the only category trending up across the whole period, reaching 31.64% penetration in July 2026 and overtaking soju (29.10%).
- Soju peaked at 33.51% around Lunar New Year (February 2026), then declined through spring.
- Makgeolli and traditional liquor showed the sharpest holiday spike, 15.87% in February 2026, before returning to the 12% range.
- Wine and spirits peaked at 4.66% in December 2025 and sat in the 3% range in spring and summer.
Convenience stores and Fridays win
A channel concentration index of 1.51
The concentration index compares a channel's share of alcohol purchases with its share of all grocery trips. Convenience stores averaged 1.51 and stayed between 1.4 and 1.6 throughout. Supermarkets (0.88–1.11) and hypermarkets (0.89–1.06) tracked general shopping, while warehouse clubs were lower at 0.64–0.79.
Day-of-week patterns
Saturday scored 1.11 and Friday 1.09; Monday was the lowest at 0.91. Saturday's share of alcohol purchases (18.7%) ran 1.9 points above its share of all purchases (16.8%), a gap that repeated every month.
Non-alcoholic is small but growing fastest
Non-alcoholic beverage penetration rose from 0.45% in January 2025 to 1.12% in July 2026, roughly 2.5x, crossing 1% for the first time in March 2026. It is still tiny next to 47% for alcohol overall, but no other category grew faster.
What marketers should take from this
- Plan seasons by category. Keep beer pushes running into summer; split soju, wine and makgeolli into a year-end-to-Lunar-New-Year push and a separate spring retention effort.
- Invest in the convenience store shelf. Multipack promotions, cooler placement and smaller pack sizes may return as much as hypermarket events.
- Weight media toward Thursday–Saturday and trim Monday delivery.
- Treat non-alcoholic as its own category, not a line extension.
For measuring retail media all the way to purchase, see What CLIO Learned After a 1,500% ROAS on Olive Young Co-op Ads. For how consumer goods companies are shifting ad budgets, read Ad-to-Sales Ratio: CPG Giants Spend More While Big Tech Pulls Back.