Most brands still don't have a clear picture of how much traffic AI Overviews send them. Google hasn't given a clean signal for AI Overview traffic in Search Console, so it is hard to know how much organic traffic comes from AI Overviews, which content drives it, and how accurately that traffic gets reported.
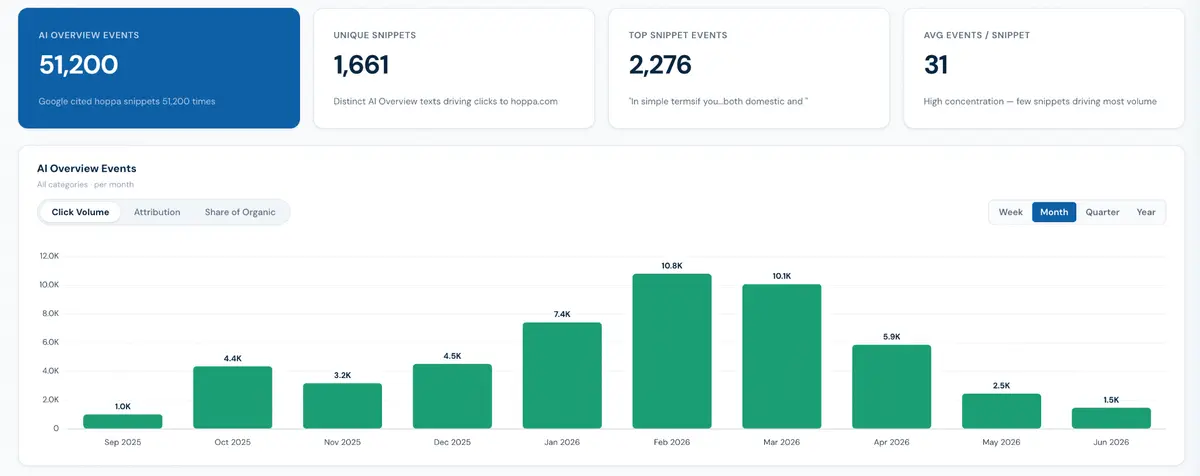
SEO practitioner Alex Galinos built his own tracking for a transportation-industry brand starting in September 2025. From September 2025 to June 2026, the setup recorded 51,200 tracked events across 1,661 cited snippets. Here is what nine months of data showed.
The tracking setup — already sitting in your GA4
The methodology is straightforward, and most teams simply haven't implemented it.
When a user clicks a cited snippet inside a Google AI Overview, Google sometimes appends a #:~:text= fragment to the destination URL. Create a custom dimension in GA4 that fires whenever a session lands with that fragment present.
It is not a perfect signal, but it is the most reliable one available until Google exposes this natively in Search Console. And the fragment is already in your GA4 data right now. You just need to surface it.
Citations concentrate hard
Grouping snippets into thematic categories surfaced a few things immediately.
Concentration is high. The single top-performing snippet drove 2,276 events. The average across all 1,661 snippets is 31. As with most things in SEO, a small number of pages do the bulk of the work.
Snippets have lifecycles. Some peak during a specific period and then fade — usually when query intent shifts seasonally, or when the content goes stale relative to what Google now prefers to cite. Others emerge months after publication and keep climbing. Freshness and specificity matter more than you'd initially assume.
Which content types get cited
In this dataset:
- Transfer time content and pricing content are cited frequently with clear upward momentum. The play there is refreshing and expanding what exists.
- Destination guides underperform relative to what the data suggests they could drive.
- Structured transport comparison tables, formatted as actual HTML tables, punch well above their weight on citation frequency.
That last one is the tell. It says something about how AI Overviews select content to surface, and it matches what most people working in GEO find: AI Overview citations favor content that is specific, structured, and directly answers a well-defined question. Times, prices, named routes, comparison formats. Not vague editorial.
It connects to the argument in Most AI Visibility Gains Are Just Technical Debt Repayment: citations come from structuring information properly, not from a special GEO tactic.
The most striking finding: 22.4% misattribution
Plotting the dataset in a GA4 exploration report revealed that a meaningful share of traffic arriving via AI Overviews was being attributed to the Direct channel rather than Organic Search.
AI Overviews only exist within Google Search. Traffic from there should be organic. So misattribution tracking was built into the dashboard and measured monthly and weekly.
Across the full dataset — more than 50,000 AI Overview events over nine months — the average misattribution rate was 22.4%: 11,468 events attributed to Direct instead of Organic. The range varied by month:
- Worst month: May 2026 — 29.3% of AI Overview sessions misattributed to Direct
- Best month: April 2026 — 16.8% misattributed
The reporting implications are significant. Depending on total organic volume and how much AI Overview referral traffic you generate, you could be materially underreporting organic performance without realizing it.
7.53% of organic sessions — but volatile
Using the same first-party dataset, a percentage metric tracked what share of total organic sessions came from AI Overviews each period. From September 2025 to June 2026 the figure was 7.53%. The distribution is not flat.
At its peak in February–March 2026 it reached 16–17% — nearly one in six organic visitors arriving via an AI Overview. More recently it has trended down to around 2–4%.
That volatility matters. It suggests AI Overview prominence in the SERP is not stable, fluctuating with query type, Google's confidence in available content, and possibly broader algorithmic changes. Brands treating AI Overview traffic as a fixed percentage of organic are likely miscalibrating their models.
Two limitations to know
The #:~:text= identifier isn't exclusive to AI Overviews. Featured Snippets and People Also Ask results use the same fragment, so some of what gets captured may bleed from those formats. In this case an Ahrefs check found fewer than 30 Featured Snippet inclusions, largely because the site doesn't target terms that trigger them. Given the volume and the collection period, AI Overviews are believed to be the dominant driver — but it isn't a perfectly clean signal.
The metric compares events to sessions. The GA4 custom dimension is event-scoped, not session-scoped, so the AI Overview share compares events against sessions. Directionally accurate and better than nothing, but worth knowing if you replicate it.
What this means for marketers
If you aren't tracking this yet, start. The setup isn't complex, and the signal — imperfect as it is — is the best first-party data available until Google surfaces it natively.
Four takeaways from nine months of data. Structured, specific content wins. Freshness matters more than you think, because snippets have lifecycles and stale content loses citation share. Your organic traffic is likely underreported. And the share is volatile, so don't treat a peak month as a new baseline.
That last point mirrors the problem raised in Only 1.1% of News Publisher Visits Carry an AI Referrer: referrer-based measurement structurally understates AI's influence. Either way the conclusion is the same — don't take platform channel classification at face value, and build one first-party check of your own.